Troubleshooting Slow Render Mode Performance
Question:
How can I make Rhino 6 or 7 use my GPU to its full potential?
“I wonder why Rhino for instance cannot draw more Power from my graphics card running on only 35Watts whereas it could potentially draw 150-160Watts. GPU usage is 11%-22% depending on the display mode? For me, this is what I get:
Arctic viewport: GPU draws 30 Watts has an GPU utilization of around 10% and gives 6FPS
Shaded viewport: GPU draws 35 Watt has an GPU utilization of around 22% and gives 30 FPS”
Answer:
Power Draw
You may be referring to the “power draw” in the above question. If your GPU is only drawing 35W, when it’s designed to support up to 150W, then it means that it’s operating at roughly 20% capacity.
You may be expecting that “If something takes 10 seconds, then if I get a card that’s 10x faster, then it should only take 1 second”.
This is only true if 100% of the time Rhino spent on the GPU, which is not the case.
But if only 1% of the time is spent on the GPU, then the result is basically going to be the same…10 seconds.
Why? This is because the problem (or bottleneck) is not with the GPU, so speeding up the GPU, or replacing it with a much faster one, isn’t going to do a thing.
Start with the Model
Getting us a model is the best way for us to know where the bottlenecks are.
You can submit a model for testing to tech support here.
(Fill out the comment field in the upload with all the details, so we know what issue you are having and what version of Rhino you are using. Incomplete information can result in a delayed response from technical support.)
For example, if you are getting 3 fps Rendered mode result and a Shaded mode yields ~50 fps, that does seem concerning.
Without knowing what is in your model, we would guess that it's probably something to do with his object management, blocks, and lighting or some combination of both The use of multiple lights can have an abysmal performance.
You will first need to first eliminate the typical CPU bottlenecks in the file geometry and setup, before you can expect good GPU performance.
Measuring GPU Performance
How are you gauging your GPU usage? If you are only using TestMaxSpeed, then that is problem #1. Rhino’s display is a passive frame display, not an active one. Rhino does not try to generate constant frame rates at all times (like a computer game does). It draws a single frame, ends and exits.
Trying to determine overall GPU usage on a single frame would be like trying to determine how fast your car’s top speed is by measuring how fast it takes it to move one inch from at rest position, and then extrapolating that into miles per hour. Not a good approach to finding the best answer.
A better way (but still only an approximation) is to use the Rhino's TurnTable command. Turntable does try to maintain constant frames, and most GPU monitoring tools can then post better results. There is a Hollomark for specifically V6 and V7, which can be found on the Rhino support forum. We do not write or support it, but it can be useful.
File Analysis
Here are some recommendations to improved performance of a file that is slow. These may improve the general overall performance of your file in may more ways, as well.
- Keep the overall number of objects in the scene as low as possible and not excessive so the object management overhead is not the bottle neck.
- Organize your file in and assign “objects” to “layers”.
- Check for bad objects and rebuild them.
- Avoid excessive usage of blocks
- Purge unused content in your file like materials and textured.
- Reset your Render mode settings to default (Options → View → Display modes → Rendered. Pick button at bottom to reset to Rhino defaults.)
- Insert the contents of your file into a new file. (This may leave some problem with the file behind.)
But still, the display performance can seem sub-par and painfully slow.
If different “shaded” display modes all seemed to produce similar performance results, except the Rendered display mode which can be significantly slower than the other modes. However, it is expected that Rendered modes will be slower, but if the differences seen with same content are excessive, here is why.
Rendered Mode
Now you can focus on the Rendered mode results to determine why and where things were slowing down. Many well organized files with no bad geometry can bring Rhino’s rendering pipeline to a standstill.
Another reason is transparency maps. There can be thousands of objects referencing several dozens of materials, many of which contain “transparency maps”.
Why is this problematic? There is no guaranteed order for which objects get drawn in Rhino, which means for each and every object, Rhino will setup and initialize the GPU rendering stack (shaders, textures, content settings, etc…) prior to drawing it.
These “context switches” can become very timely, and end up overwhelming the CPU usage, which in turn, starves the GPU from getting used to its full potential. In other “shaded” modes, certain optimizations can be made to prioritize things because Rhino knows that a given set or group of objects will all be drawn using the same material. Also with the use of “sub-object materials” in your model, Rhino cannot do the same kind of optimizations, and so they are skipped entirely.
To compound the problem, “transparency” requires up to 4 separate passes per object in order to get the best looking transparency possible. Now add to all of that, the multiple passes required for the “shadowing” phase (where transparency maps also need to be applied), the display starts to become mired in an endless process of initializations and context switches, resulting in very poor performance.
No Quick Fixes
Unfortunately, there are no immediate fixes, suggestions or workarounds for this type of situation. We understand that products like TwinMotion seem to run much faster in what appears to be a “similar” situation, and that Rhino should also be able to perform as well.
However, the path from a Rhino object to colorful pixels on the screen is a very complex and tedious process that does not take place in these other products.
TwinMotion and similar products are only interested in two things;
- Polygons
- The color of said polygons.
Once they have all of the information for all of the polygons, there are all kinds of optimizations that can be made.
Testing and Analysis
Here is the procedure Rhino developers use to test a file for display pipeline issues:
First, convert all Rhino objects into their equivalent render meshes, and “joined” the render meshes into single, disjoint mesh based on the material each was using.
This does several things:
- It reduces the overall number of objects that need to be processed.
- It allows Rhino to draw ALL objects that use the same material all in ONE single draw.
- It frees up the CPU usage so that the GPU can be pumped as fast as possible, resulting in not only orders of magnitude increase in frame rates, but almost a 100% GPU utilization.

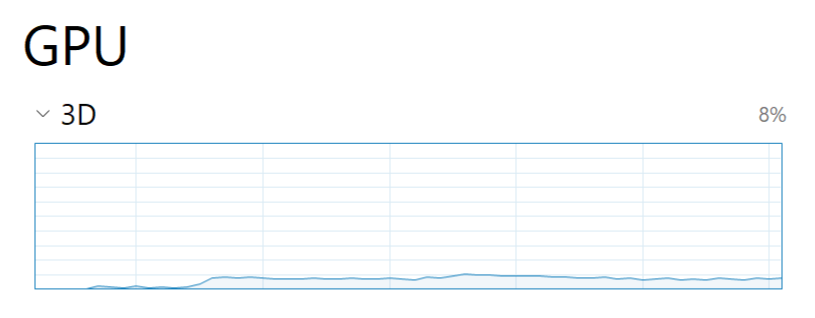
This GPU graph above is of Rhino running “Turntable” using a file “as is”.

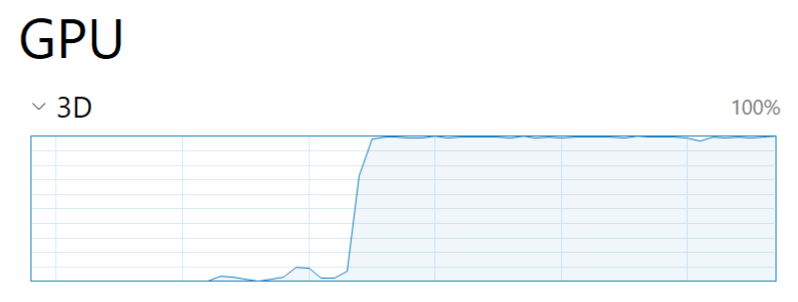
This GPU graph above shows the same file with the optimizations explained above.
With these graphics, you can see the huge difference in GPU utilization, which you see in a product like TwinMotion.
In conclusion
The reason the GPU utilization is low using some files is because most of the time is being spent on the CPU. This is why replacing the GPU with a faster one isn’t going to make any difference. Once the bottlenecks on the CPU have been eliminated, the GPU is free to run at full steam, this is what the second graph shows.
As mentioned, there is no immediate solution that you can apply to your Rhino file or workflow to make this faster, other than what we what we did to your file.
We hope this will help you understand why this is happening and give you assurance that this is just an unfortunate series of circumstances that Rhino is unable to currently overcome.
With that said, we are committed to solving the issues mentioned above over time, and are always trying to make changes/additions to Rhino that will improve overall performance in future versions.
Question? Please email Mary Ann FugierMary Ann Fugier, Rhino Technical Support, Seattle WA.